Test
Blog
-
Create a weather map using OpenWeather API in Python
Current weather data provided by Open Weather API allows you to get weather information for free for any location on our planet. All you need is to register and get an API key to make requests.
In this post, I would like to show you how to generate a weather map for a list of cities showing the city name, temperature and weather type icon.
Following libraries will be used to load and process data:
For example, let’s use the following locations:
import requests
import pandas as pd
from geopy.geocoders import Nominatim
from geopy.extra.rate_limiter import RateLimiter
For example, let’s use the following locations:
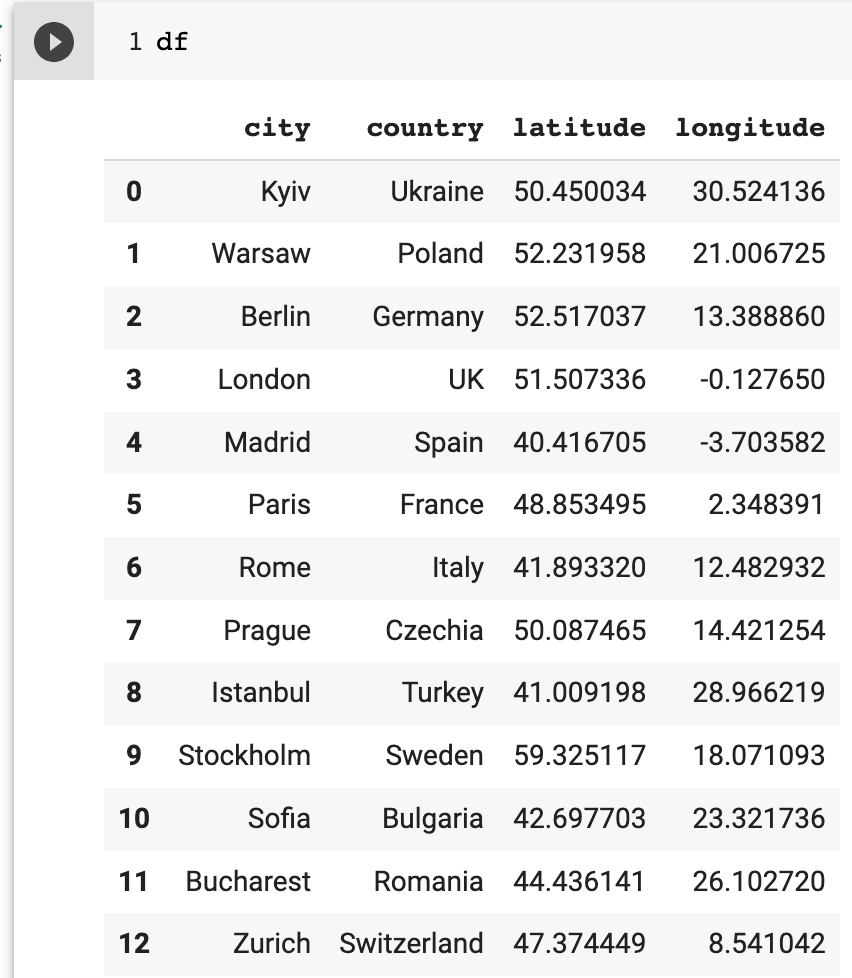
cities = [
    ["Kyiv", "Ukraine"],
    ["Warsaw", "Poland"],
    ["Berlin", "Germany"],
    ["London", "UK"],
    ["Madrid", "Spain"],
    ["Paris", "France"],
    ["Rome", "Italy"],
    ["Prague", "Czechia"],
    ["Istanbul", "Turkey"],
    ["Stockholm", "Sweden"],
    ["Sofia", "Bulgaria"],
    ["Bucharest", "Romania"],
    ["Zurich", "Switzerland"],
]
df = pd.DataFrame(cities, columns=["city", "country"])
Since the OpenWeather API endpoint requires geographical coordinates such as latitude and longitude, we need to perform geocoding for each city. I would like to use the Nominatim geocoder provided by OpenStreetMap.
locator = Nominatim(user_agent="myGeocoder")
geocode = RateLimiter(locator.geocode, min_delay_seconds=.1)

def get_coordinates(city, country):
  response = geocode(query={"city": city, "country": country})
  return {
    "latitude": response.latitude,
    "longitude": response.longitude
  }

df_coordinates = df.apply(lambda x: get_coordinates(x.city, x.country), axis=1)
df = pd.concat([df, pd.json_normalize(df_coordinates)], axis=1)
After running this code. Additional columns with coordinates will be added to the pandas DataFrame:
We should store the open Weather API key in openweathermap_api_key variable. It will prompt you to enter the API key while running the code.
from getpass import getpass
openweathermap_api_key = getpass('Enter Openweathermap API key: ')
Now we can get weather information for each location
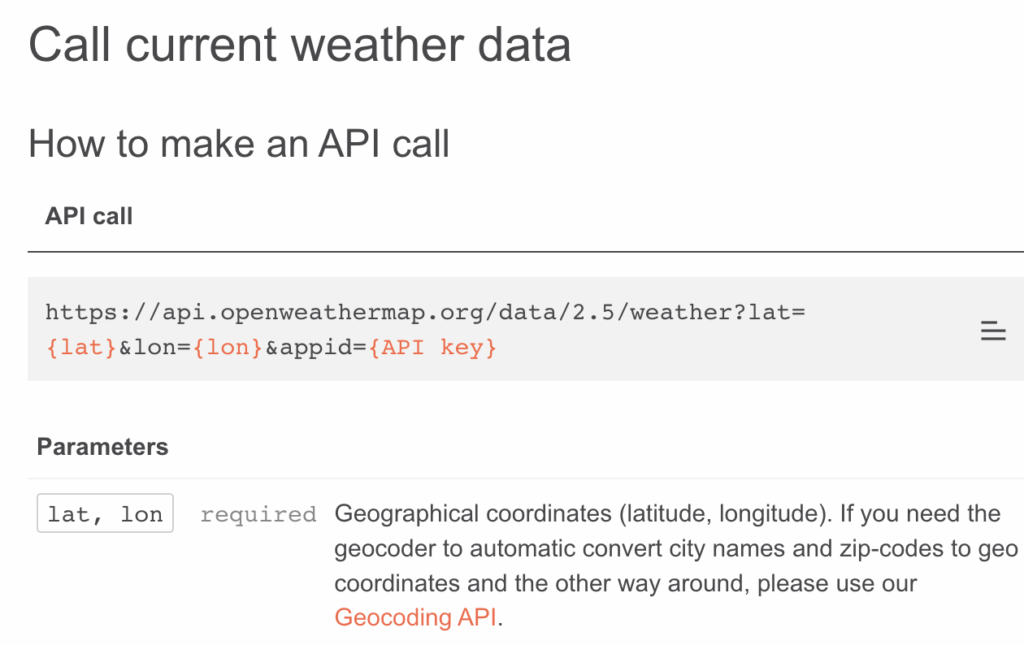
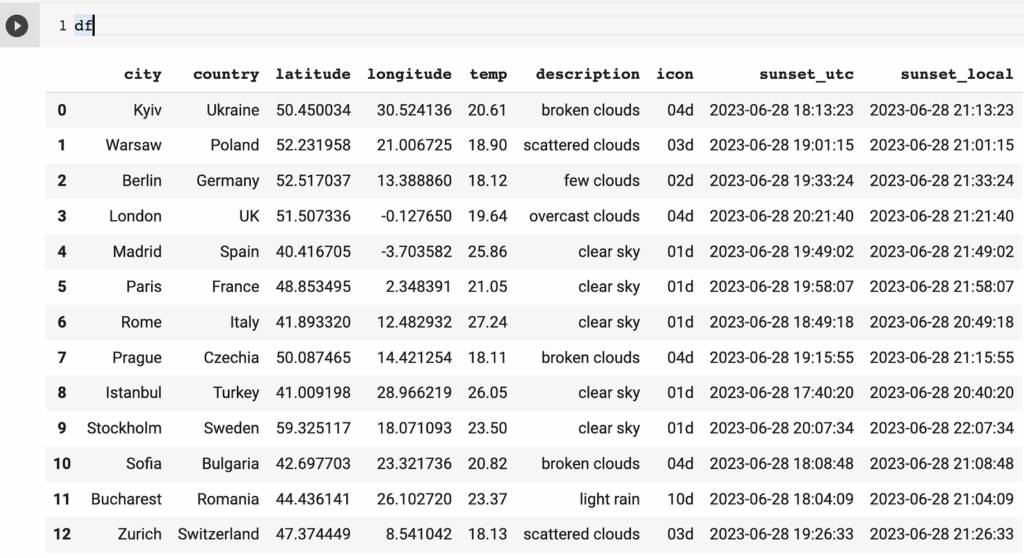
import datetime

def get_weather(row):

  owm_url = f"https://api.openweathermap.org/data/2.5/weather?lat={row.latitude}&lon={row.longitude}&appid={openweathermap_api_key}"
  owm_response = requests.get(owm_url)
  owm_response_json = owm_response.json()
  sunset_utc = datetime.datetime.fromtimestamp(owm_response_json["sys"]["sunset"])
  return {
      "temp": owm_response_json["main"]["temp"] - 273.15,
      "description": owm_response_json["weather"][0]["description"],
      "icon": owm_response_json["weather"][0]["icon"],
      "sunset_utc": sunset_utc,
      "sunset_local": sunset_utc + datetime.timedelta(seconds=owm_response_json["timezone"])
  }

df_weather = df.apply(lambda x: get_weather(x), axis=1)
df = pd.concat([df, pd.json_normalize(df_weather)], axis=1)
As you can see in the code, we do the following processing after weather information loads:
- I convert temperature from Kelvin into centigrade
- I converted sunset time from Unix Epoch into UTC datetime and the local time zone
The response also contains other weather information, so you can API response.
The result for today, 28 June 2023, looks like this:
To visualize results, Geopandas with contextily will be used to render the map with a base layer. I am running my example using Google Colab, and you can install these additional libraries by running:
try:
  import geopandas as gpd
except ModuleNotFoundError:
  if 'google.colab' in str(get_ipython()):
    %pip install geopandas
  import geopandas as gpd

try:
  import contextily as ctx
except ModuleNotFoundError:
  if 'google.colab' in str(get_ipython()):
    %pip install contextily
  import contextily as ctx
Convert pandas DataFrame into GeoDataFrame and create a geometry column with coordinates. Note that CRS is set to 4326 which sets the coordinate system to WGS84 — World Geodetic System 1984. Which is latitude and longitude in degrees.
gdf = gpd.GeoDataFrame(df, geometry=gpd.points_from_xy(df.longitude, df.latitude), crs=4326)Now the map can be rendered using Geopandas and Matplotlib.
from skimage import io
import matplotlib.pyplot as plt
from matplotlib.offsetbox import AnnotationBbox, OffsetImage

# plot city location marker
ax = gdf.to_crs(epsg=3857).plot(figsize=(12,8), color="black")

# add weather icon
def add_icon(row):
  img = io.imread(f"https://openweathermap.org/img/wn/{row.icon}@2x.png")
  img_offset = OffsetImage(img, zoom=.4, alpha=1, )
  ab = AnnotationBbox(img_offset, [row.geometry.x+150000, row.geometry.y-110000], frameon=False)
  ax.add_artist(ab)

gdf.to_crs(epsg=3857).apply(add_icon, axis=1)

# add city name label
gdf.to_crs(epsg=3857).apply(lambda x: ax.annotate(text=f"{x.city}  ", fontsize=10, color="black", xy=x.geometry.centroid.coords[0], ha='right'), axis=1);

# add temperature
gdf.to_crs(epsg=3857).apply(lambda x: ax.annotate(text=f" {round(x.temp)}°", fontsize=15, color="black", xy=x.geometry.centroid.coords[0], ha='left'), axis=1);

# add margins
xmin, ymin, xmax, ymax = gdf.to_crs(epsg=3857).total_bounds
margin_y = .2
margin_x = .2
y_margin = (ymax - ymin) * margin_y
x_margin = (xmax - xmin) * margin_x

ax.set_xlim(xmin - x_margin, xmax + x_margin)
ax.set_ylim(ymin - y_margin, ymax + y_margin)

# add basemap
ctx.add_basemap(ax, source=ctx.providers.Stamen.Watercolor)

ax.set_axis_off()
This weather map for 28 June 2023 was rendered using OpenWeather API and geopandas To ensure that labels do not go outside map boundaries, I have added horizontal and vertical margins. There is also a code that loads and displays the weather map icon in PNG format.
Feel free to modify my example by running the complete code example in the Google Colab notebook, please note that you will need to provide your own Open Weather API key.
OpenWeather API paid access allows you to get additional details and historical data. Please check OpenWeather API documentation.
I hope you found this example useful.